


Your CEO asks why incidents in the finance department are taking twice as long to close. You know the answer. You have lived in those tickets for weeks. But knowing is not the same as showing, and without a proper dashboard, the work stays invisible.
That is the gap the Advanced GLPI Dashboards plugin is built to close.
Three ways to report in GLPI
CSV exports. Run a search, export the file, open it in a spreadsheet. It works, but it is manual, disconnected from what is happening right now, and you have to do it again every time someone asks.
Saved searches. One of the most underused features in GLPI. Build a filter once, say, all computers without warranty or Windows machines on version 22H2, save it as public, and reuse it with a single click. No rebuilding filters from scratch every week.
Built-in dashboards. Available since GLPI 9.5, you can create multiple views, choose which widgets appear, and share dashboards with specific user profiles or via a direct link. That already covers a lot of ground. The built-in cards, however, only display pre-defined data. If you need to go further, the plugin picks up from there.
What Advanced GLPI Dashboards adds
The plugin is available on GLPI Network Standard subscriptions and above for on-premises clients, and on all GLPI Cloud instances.
It unlocks two things.
First: any saved search can become a dashboard card. A big number, a list, a chart. A filter that previously lived in a menu becomes a live widget on your dashboard.
Second: a built-in SQL editor with autocomplete. It pulls the actual tables and columns from your GLPI database as you type. If you can define a metric, you can write a query for it and display it on a dashboard.
A few practical examples:
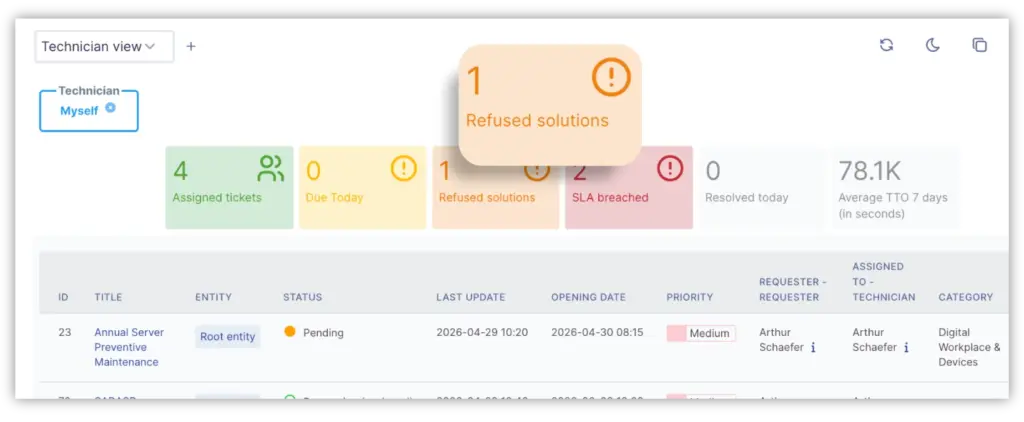
A counter showing tickets where the last solution was refused by the user
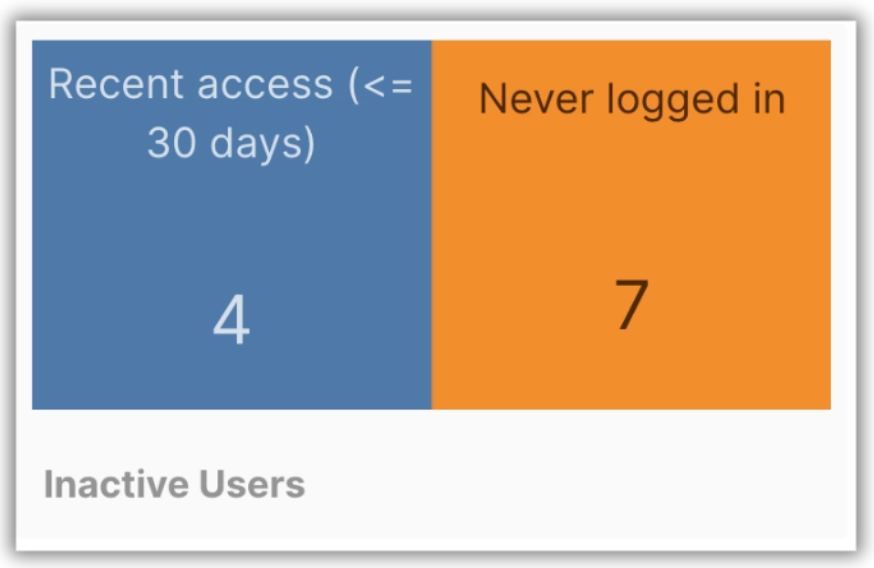
A query listing active users who logged in over the last 30 days versus those who have not logged in at all
A technician view showing their assigned tickets, SLA breaches today, and top categories, filtered automatically to whoever is logged in
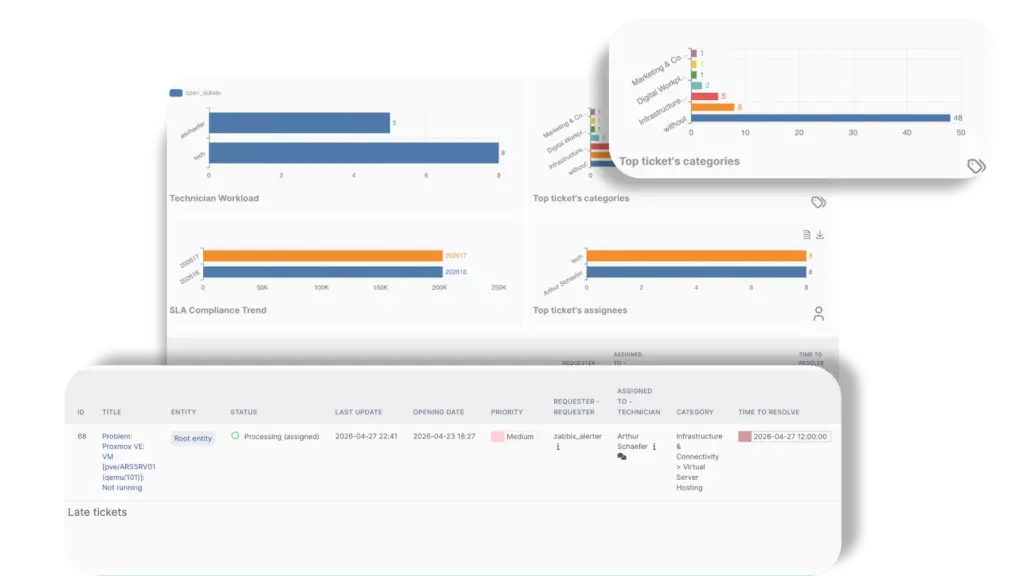
Each card can also link to the filtered list behind it, so clicking a number takes you straight to the relevant tickets.
Advanced Dashboards or Metabase?
GLPI also has a Metabase plugin that embeds external Metabase dashboards directly inside the interface. The choice is straightforward: if you want everything inside GLPI with no extra infrastructure, use Advanced GLPI Dashboards. Saved searches and SQL queries cover the vast majority of what IT teams need to report on. If you already run a separate analytics stack, or need to combine GLPI data with other databases, Metabase makes sense. The main trade-off is that Metabase requires another server to manage.
A few things worth knowing before you start
Make saved searches public when sharing across teams. Otherwise other users will not see them on their dashboards.
Use the SQL editor's autocomplete. It saves you from guessing table names in a database you are not browsing daily.
Keep performance in mind. Complex queries run every time the dashboard loads. That matters more on large GLPI instances or widely shared dashboards.
Build role-specific dashboards. What a technician needs to see is not what a coordinator needs, and definitely not what an executive needs. A single catch-all dashboard rarely serves anybody well.
Try it
A 45-day GLPI Network trial is available. It includes the plugin along with the rest of the premium stack. If you already have it running and want to go deeper, the GLPI partner network is a good starting point.
📚 Advanced GLPI Dashboards Documentation
💬 Advanced GLPI Dashboards FAQ
